
Analytics
The Analytics page, under Administration. Who is in the community right now, the visits and where they come from, the search engines and AI assistants that read the pages, and the seven-step purchase funnel, from visits to payment, with who stopped at each one. What counts as a visit and what is never stored.
The Analytics page shows "who visits the community, who is in it right now and where the buyer gives up." It belongs to Memberfy itself and works without any setup; if the community uses Google Analytics, the two live side by side.
It's in Administration › Analytics, right below Engagement.
Who can
| Role | What they see |
|---|---|
| Owner and admin | All four views, in the switch at the top: Realtime, Overview (with Most read content), Purchase funnel and Search engines and LLMs |
| Finance | Only Purchase funnel |
| Moderator and member | Don't see the page |
How it works
Realtime
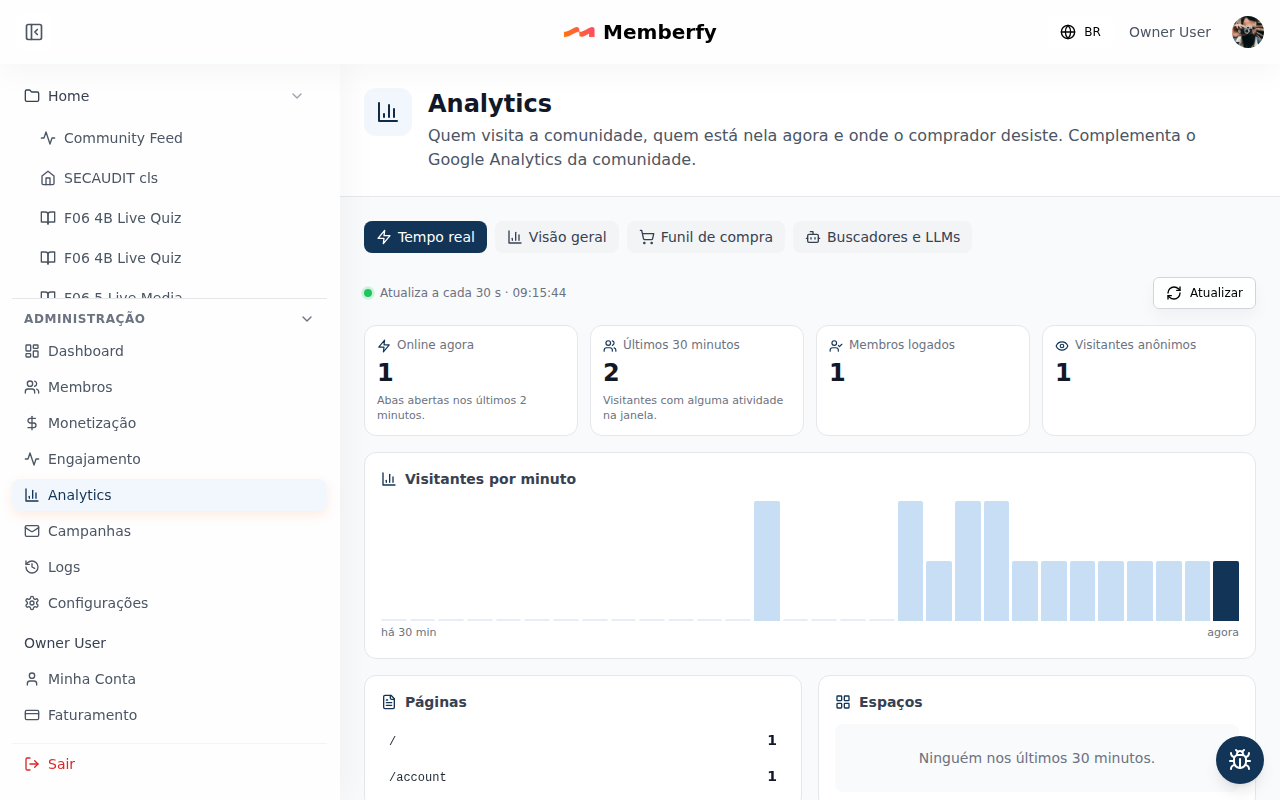
Who is in the community's app right now. The view updates live, as soon as someone comes in or leaves, and shows "Live · updated at {time}".
- Online now: tabs open in the last 2 minutes, split into Logged-in members and Anonymous visitors. One person with two tabs counts once.
- Last 30 minutes: visitors with any activity in the window, and the Visitors per minute chart.
- Where they are: Pages, Spaces, In the purchase funnel, Countries and Devices, and Online now by space.
Overview
At the top, the Period button opens a menu with 7 days, 30 days, 90 days and Custom (From and To), up to 366 days, compared with the previous period of the same length.
| Number | What it is |
|---|---|
| Pageviews | Pages opened |
| Visits | The sum of each day's visitors. They are not unique people over the period: someone who came on three days counts as three visits |
| Sessions | Trips to the app: an open tab counts as one session until it's closed (or until the person signs out) |
| Member visits and Anonymous sessions | Who was logged in and who wasn't |
| Average time on page | Until the next page of the same session, at most 30 minutes |
Below: the By day chart; Pageviews grouped by Page, Space or Day; and where visits come from: Source (the site that sent the person, or Direct or unknown), Campaigns (utm_source), Countries and Devices.
Most read content
Still in Overview, below Pageviews, the Most read content block lists the most read posts in the chosen Period, with each one's space, reads, expansions, clicks and most clicked domains. The post title leads to its page. Only the owner and the admin see the block.
| Number | What it counts |
|---|---|
| Reads | Opened the post page |
| Expansions | Opened the post's …see more in the Feed or in the space's list |
| Clicks | Clicked a link in the post. Only the domain is kept, and clicks inside an embedded player (YouTube, Spotify) don't count |
Each number counts one person per day: someone who comes back on another day counts again, and the period adds up the days. Counting started on October 28, 2026. The numbers for a single post, since it was published, are on its page, in Reads of this post. Reads don't change Pageviews or Visits.
Search engines and LLMs
The search robots (like Google's) and the AI robots (like ChatGPT's and Claude's) that read the community's pages, with Pages robots read most. Robots don't count as visits: they stay in this view only. Discarded are bad robots and excess events, which count toward nothing.
Purchase funnel
The buyer's path, from visits to payment. In Product, choose All products or one or more products and plans: the picker has search, Select all and Clear, and groups them into Plans, Add-ons and Products, courses and events.
The seven steps, each with a line explaining who counts in it:
| Step | Who counts |
|---|---|
| Visits | Came into the community, on any page, logged in or not |
| Saw the showcase | Opened the product showcase, or went straight to a product through a link |
| Viewed a product | Opened a product or plan page (description, price and buy button) |
| Started checkout | Opened checkout and filled in their details |
| Reached payment | Reached the payment method choice |
| Placed the order | Finished and placed the order |
| Paid | Payment was confirmed |
Each visit counts in every step up to the furthest one it reached. The chart shows how many reached each step, the share of visits (% of visits) and the rate relative to the previous one ("62% of the previous step"). By product compares products side by side.
- Visits are always the whole community, even with products chosen, and split into anonymous and logged-in members.
- In Saw the showcase, the line "12 went straight to a product" counts who arrived through a product link without going through the showcase.
- Orders outside the funnel: orders with no visit recorded in the app (through a direct link, the assistant or the API) appear separately, below the chart ("+3 orders outside the funnel"), with how many were placed and paid per channel. They don't enter the steps.
- Data since: the funnel only exists from the day collection started in the community. If the period starts earlier, the notice "Data since …" says when the numbers start.
On each step, Who stopped here opens the Stopped at: … window with the members whose furthest step in the period was that one: search by name or email, pages of 20, when each one was last seen and which products they stopped at. Click the name to open their profile. Anonymous visitors only go into the numbers: the list shows only logged-in members.
What counts and what is stored
- Only people count: robots stay in Search engines and LLMs.
- The IP is never stored.
- Visits show up within 1 minute.
- Detailed events are kept for 30 days; the daily summary, forever. That's why Who stopped here covers at most the last 30 days.
Online now on the Dashboard
The owner's and admin's Dashboard gets the Online now card: how many people are in the app ("3 members · 5 visitors") and how many in the last 30 minutes, with Open Analytics.
The Online now card updates live.
Step by step: where checkout loses people
Role: owner, admin or finance.
- Administration › Analytics, Purchase funnel view.
- In Period, 30 days; in Product, the products you want to look at.
- Find the step with the lowest "of the previous step" rate.
- Click Who stopped here: in the Stopped at window, search by name or email and open each person's profile.
Example
The showcase that didn't convert. Carla sees in the Purchase funnel that 400 people opened the Mentoring product, but only 40 started checkout. In Overview › Source, nearly everything comes from Instagram, on mobile. She shortens the product page, and the next month compares the step's rate with the previous period.
Frequently asked questions
Why don't the visits match Google Analytics? Each tool counts its own way: here, robots don't count and "visits" is the sum of each day's visitors. Use each one for what it shows best.
Can I find out who visited? Only the logged-in members who stopped at a funnel step, in Who stopped here. Anonymous visitors are just numbers.
Does a post's author see its reads? Yes, on their own post's page, in Reads of this post. The Most read content block, with every post, is only for the owner and the admin.
What do I need to set up? Nothing. Counting starts by itself.
Through the assistant
analytics_report reads the overview, the pageviews, the funnel and the most read content (view: "content"); get_post_metrics, one post's reads; get_online_now, realtime.
In the API
GET /api/analytics/content: the most read content of the period (from,to,limitfrom 1 to 50, default 10), with each post's reads, expansions, clicks and most clicked domains. Owner and admin only.GET /api/analytics/content/{contentId}: one post's metrics (fromandtooptional; without them, from publication to today). Owner, admin and the post's author; other roles get403, and a post from another community,404.- The collector
POST /api/analytics/eventsaccepts, besidespage_view,funnel_stepandheartbeat, the typespost_expand(…see more) andpost_link_click(a click on a link, with the domain only); the post page'spage_viewcarriescontentId.
See Analytics.